See also: For the Printed Documents Including Patron Personally Identifiable Information (PII) policy and the accompanying agreements go to the Personally Identifiable Information (PII) page.
BLUEcloud Analytics (BCA) Login Link
After you have been granted access, use the following link for BLUEcloud Analytics (BCA)
Go to the BLUEcloud Analytics (BCA) Login Screen 🔗
Important BLUEcloud Analytics (BCA) Facts
User logins are personal and access will be terminated for any user who shares their username and password.
Data is refreshed each day at 1 AM.
Whitelist these email addresses to ensure you get scheduled emails from BLUEcloud Analytics (BCA):
*
*
Cheat Sheets and Guides
Popular Reports for Circ Managers and Where to Locate Them
This document lists the Most Popular Reports for Circ Managers and Where to Locate them in BCA. Created August 25, 2023
Download the Most Popular Reports for Circ Managers and Where to Locate them in BCA document
BLUEcloud Analytics (BCA) User Reference Guide
The BLUEcloud Analytics (BCA) User Reference Guide is the initial training guide and a handy reference to all the icons on menu options in BCA. We suggest having a copy on-hand to reference until you are comfortable using BCA. This reference guide does not specifically cover topics in great detail. See the cheat sheets and guides below for task specific documentation. Updated 15 January 2025.
Download the BLUEcloud Analytics (BCA) User Reference Guide
BLUEcloud Analytics (BCA) Data Reference Guide
Convert the BLUEcloud Analytics (BCA) terms to Symphony database terms. BCA works with both Symphony and Horizon and many terms are not Symphony specific. This is the SirsiDynix source document that lists all BCA data elements and what they point to in the Symphony (and Horizon) database. In most cases the document you really want is the next one down, the BCA – Workflows Terminology cheat sheet.
Download the BLUEcloud Analytics (BCA) Data Reference guide
BLUEcloud Analytics (BCA) – Workflows Terminology
A visual guide to Workflows displays and their corresponding terms in BLUEcloud Analytics (BCA). May 2025.
Download the BLUEcloud Analytics (BCA) – WorkFlows Terminology cheat sheet
Instructions for Subscribing to Reports via Email in BLUEcloud Analytics (BCA)
A quick run through the process of running, then scheduling a report to be emailed out to you or someone else from BLUEcloud Analytics (BCA). July 2016.
Download the Instructions for Subscribing to Reports via Email in BLUEcloud Analytics (BCA) guide
BLUEcloud Analytics (BCA) – Save & Save As vs Create Personal View
This explains the difference between saving a report (Save & Save As) and Creating a Personal View of a report. May 2025.
Download the BLUEcloud Analytics (BCA) – Save & Save As vs Create Personal View cheat sheet
BLUEcloud Analytics (BCA) – Exploring Data with Excel
A short guide to using the Filter function in Excel to analyze or better view your data. Works best on reports with lots of data like shelflist reports. September 2016.
Download the BLUEcloud Analytics (BCA) – Exploring Data with Excel guide
Logging In
A cheat sheet to logging into BLUEcloud Analytics (BCA). August 2024.
- Download the BLUEcloud Analytics (BCA) – Logging In cheat sheet
- Video guide on the RSA YouTube channel 3:25 minutes

BLUEcloudAnalytics (BCA) – Running a Report Cheat Sheet
Demonstrates the basics of running a report. August 2024.
- Download the BLUEcloud Analytics (BCA) – Running a Report cheat sheet
- Video guide on the RSA YouTube channel. 4:29 minutes
BLUEcloudAnalytics (BCA) – Creating a Personal View
A guide to creating a personalized view of a report, saving your prompts & display preferences. August 2024.
- Download the BLUEcloudAnalytics (BCA) – Creating a Personal View cheat sheet
- Video guide on the RSA YouTube channel. 5:23 minutes
Full BLUEcloud Analytics (BCA) Training Session for Reports and Dashboards
The full Zoom recording of the Reports and Dashboards training session held on 23 January 2025.
- Training video on RSA YouTube channel. 1 hour 8 minutes
BLUEcloud Analytics (BCA) Q&A Session
The Zoom recording of the BLUEcloud Analytics (BCA) Q&A following the training session held on 23 January 2025.
- Q&A session video on RSA YouTube channel. 1 hour 8 minutes
BLUEcloud Analytics Interactive Stand-Alone Dashboards
Interactive Collection Browser
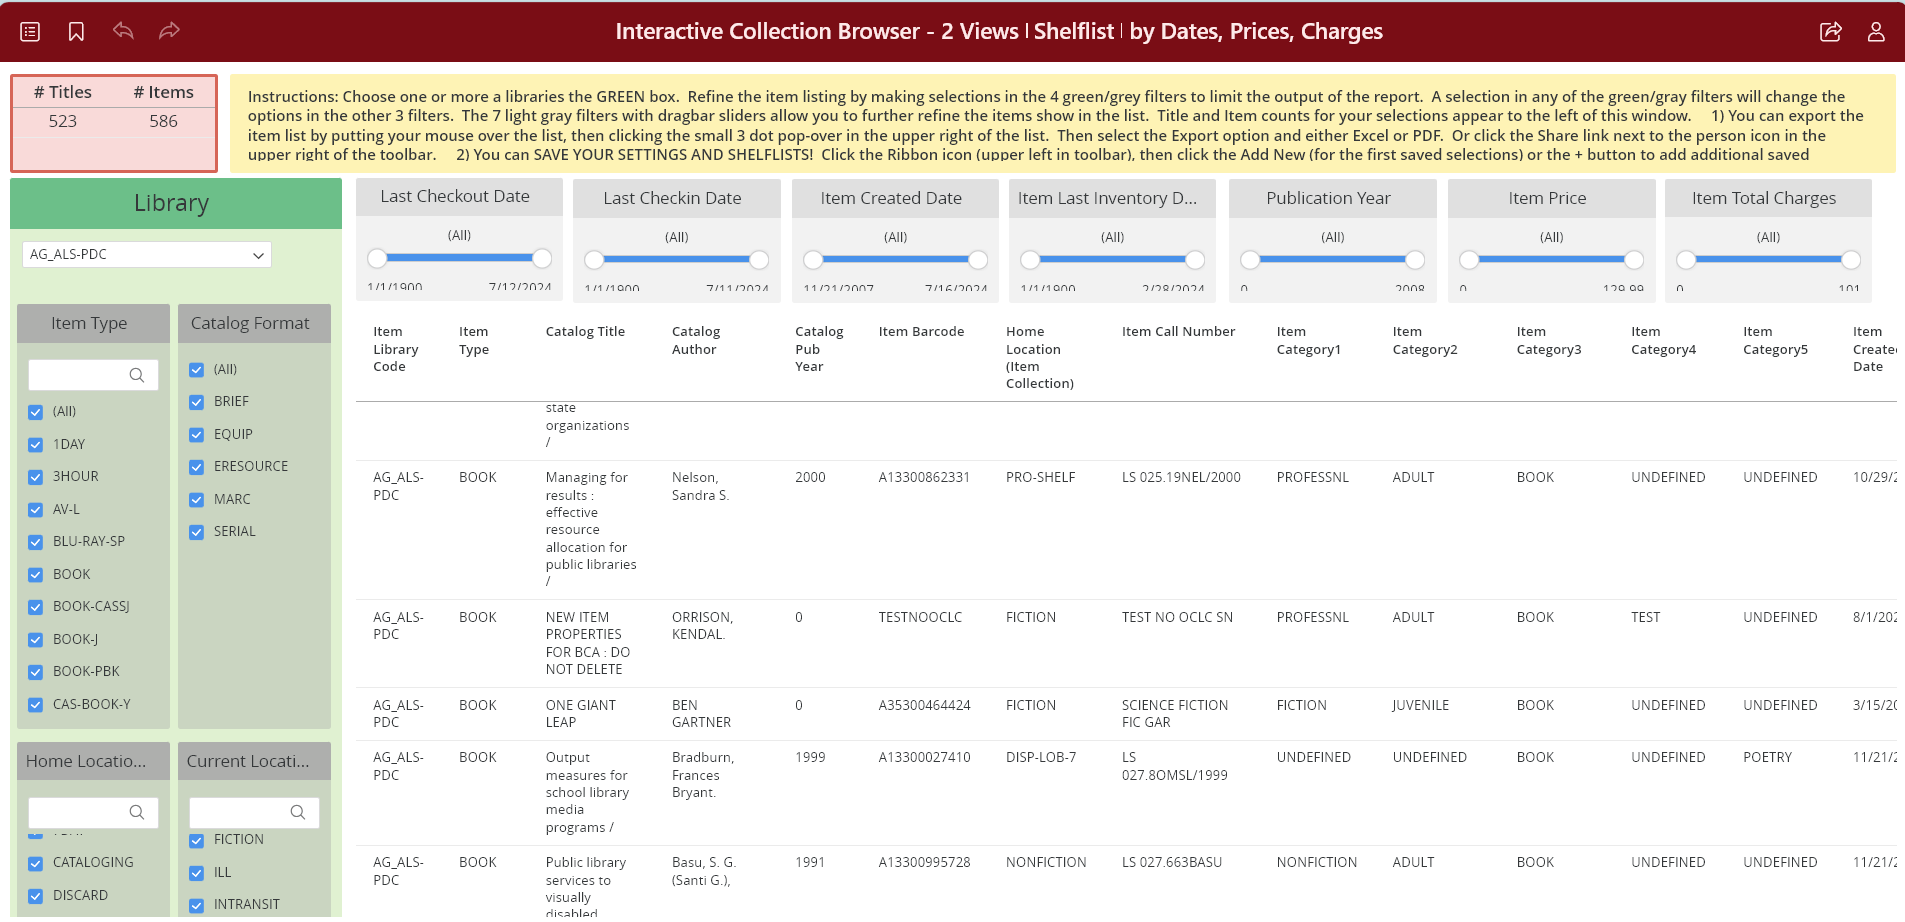
Introducing our Interactive Collection Browser. With this dashboard, you can create shelflists on the fly and dynamically change what you see in them. This dashboard has 4 chapters with several different pages of data. After logging in, the yellow box at the top of the screen has detailed instructions on how to use filters, export an item list, and even save your settings to save yourself time. LAST UPDATED 13 June 2025 to add in the Status by Inventory Year chapter.
Interactive Collection Browser (requires a BLUEcloud Analytics (BCA) user login)
Interactive Dashboard Cheat Sheet
The Interactive Collection Browser cheat sheet covers both some specifics of using that specific dashboard. It also covers the basics of Interactive Dashboard usage and most of the new elements of the new, one-click to run Interactive Dashboard interface. The interface elements are used in all the dashboards linked below.
Download the Interactive Collection Browser cheat sheet Added August 2024.
Holds Placed and Filled Interactive Dashboard
Added 16 Aug 2024
Slice and dice data to gain insights on things like where your patrons pickup their holds, what general item formats are they holding, who is pickup up holds in your library and by what general item format, and more. You can change the hold placed/filled dates to look at specific things like summer reading. This dashboard has 2 pages of visualizations and 2 pages showing the data used to build the visualization.
Holds. Placed and Filled Interactive Dashboard (requires a BLUEcloud Analytics (BCA) user login)
Using the New Holds Placed & Filled Visualization Dashboard Cheat Sheet
Download the Using the New Holds Placed & Filled Visualization Dashboard cheat sheet
Holds Filled Last 12 Months by Library Size and Type (with details by hold pickup library) Interactive Dashboard
Added 16 Jun 2025
Have you ever wondered “how much of RSA’s, or my library’s, holds run through RAILS Delivery?” Or maybe “how much money does my library save by getting holds filled by other libraries?” It could be you just want a list of Authors and Titles other libraries have sent you. This interactive dashboard can answer all those questions for the items your library has received to fill a hold for the previous 12 months.
This report can take a while to update due to the mass of data and math it’s doing to figure out the total cost of items checked out in your library. To update the 3 pannels with ORANGE headers, you need to find your library, or library plus branches if you have branches, and click the code in the breakout in the upper left. For example, AB-ALL is the group code for Abingdon – Avon District 276. If you have branches, the report will remove any holds picked up at any branch that do not belong to the group of branches. This report only shows items your library or libraries received from other RSA members.
Holds Filled Last 12 Months by Library Size and Type Interactive Dashboard (requires a BLUEcloud Analytics (BCA) user login)
Checkouts and Renewals Interactive Dashboard
This dashboard allows you to examine checkouts and renewals by date, library, user profile, checkout library, patron library, user profile, general format and more. This dashboard has 4 pages of visualizations and 4 pages showing the data used to build the visualization.
Checkouts and Renewals Interactive Dashboard (requires a BLUEcloud Analytics (BCA) user login)
Checkouts and Renewals Over Time Interactive Analysis Dashboard
Added 13 Dec 2024
This dashboard allows you to examine checkouts and renewals since 2021 for your library. The idea is that you can see trends and usage patterns by day of the week, hour of the day, or year over year. Need to see when you busiest times in November and December are? Limit checkouts to that time frame, then select only the “Staff / In Library” option to limit transactions to Workflows and selfchecks. You can alternately limit transactions further by Item Cat 2 (generally reading level) to focus in on something like Juvenile coded item checkouts. This dashboard has only a single page of visualizations. To print the charts out larger, select the Share button in the upper right, then Export to PDF. In that menu, change the Contents option to “Each visualization separately.”
Checkouts and Renewals Over Time Interactive Analysis Dashboard (requires a BLUEcloud Analytics (BCA) user login)
Reciprocal Borrows Interactive Dashboard
Added 24 Jan 2025
This dashboard breaks out both types of reciprocal borrowers at your library; checkouts by other library’s patrons, and all of the reciprocal borrower user profiles. Add both totals together to get the full count of your reciprocal borrowing circulation in the given timeframe. There are also heatmap visualizations to help better understand visually who is using your library.
Reciprocal Borrows Interactive Dashboard (requires a BLUEcloud Analytics (BCA) user login)
Transit Counts To and From My Library Interactive Dashboard
Added 15 Jan 2025
This dashboard allows you to examine items transited to and from your library either to fill a hold, or to return back to their home. You’ll see the transit reasons of “Hold” which were transited to fill a hold or “Library” which were transited back to the item owning library. You can limit the transit time-frame as you wish staring from 1 Jan 2022 through today. This shows the raw transit data, not just filled holds. I think you’ll be surprise just how many libraries your library is transiting materials too! This dashboard has 2 pages selected via the Table of Contents icon, with a combined visualization and statistical data display. As always, you can export a just the visualization, or the entire ‘page’ with the 3 dot menus in the upper right of each panel, or the overall “Share” button on the right side of the maroon menu bar.
Transit Counts To and From My Library Interactive Dashboard (requires a BLUEcloud Analytics (BCA) user login)
Most Popular Titles and Authors Interactive Dashboard
Added 24 Jan 2025
This dashboard provides, as best the system can, lists of your top title and authors in the timeframe specified at the launch of the dashboard. The dashboard allows you to slice the lists by any combination of Item Cat 2 (reading level), Item Cat 3 (General Format), and Item Cat 1 (Fic/Non-Fic). To re-prompt the report to change the display library or date range, click the Re-Prompt icon in the upper left of the menu bar. Please keep in mind that the lists aren’t perfect. The title merging requires exact matches, which mean you may see multiple versions of the same title due to spelling, capitalization changes, or punctuation differences.
Most Popular Titles and Authors Interactive Dashboard (requires a BLUEcloud Analytics (BCA) user login)